


Receive first-hand news on the latest bond issues, credit updates and special events when you join us on our Telegram channel at https://t.me/bondsupermart!
- Shangri-La Group’s FY22 performance suggests a continued recovery from the COVID-era.
- While Mainland China was a drag on performance in FY22, the recent lifting of zero-COVID measures in late-2022 may result in a positive boost for Shangri-La Group in FY23.
- We think Shangri-La Group’s overall credit profile remains stable, and its debt maturity schedule looks manageable.
- We prefer the SLHSP 4.500% 12Nov2025 Corp (SGD) over SLHSP 3.500% 29Jan2030 Corp (SGD), as we think its significantly shorter maturity makes up for its slightly lower yield.
About Shangri-La Asia Limited (“Shangri-La Group”)
Shangri-La Asia Limited (“Shangri-La Group”) is an investment holding company focusing on real estate. It is most well-known for its wholly-owned subsidiary Shangri-La Hotel Limited (“Shangri-La Hotels”), which engages in the development, ownership, and operation of hotel properties, particularly luxury hotels mainly across Asia-Pacific.
In this article, we take a closer look at two bonds issued by Shangri-La Hotels, which are also guaranteed by their parents Shangri-La Group. Our analysis below will mostly refer to the latter (i.e. group-level data) unless otherwise stated, due to the greater transparency of group-level data. Between the two bonds, we think that the SLHSP 4.500% 12Nov2025 Corp (SGD) looks fairly attractive, and will explain our rationale below.
Performance highlights of Shangri-La Group / Shangri-La Hotels
For the financial year ended 31 Dec 2022 (“FY22”), Shangri-La Group reported consolidated revenue of USD 1.46b, marking a solid +17.8% year-on-year ("yoy") from the previous year (FY21: USD 1.24b) (Chart 1). This was largely driven by its hotel operations segment (92% of total revenue) which saw a similarly robust growth of 19.5% yoy.
EBITDA figures suggest a solid recovery from COVID, similar to what we saw with revenues above. EBITDA climbed 31.3% yoy to USD 174.4m in FY22. Effective share of EBITDA (includes both subsidiaries / associates based on the percentage of equity interests) climbed 5.6% yoy to USD 441.6m in FY22 (and up 51.1% from FY19 to FY22) (Chart 2). This was primarily supported by the lifting of travel restrictions across Asia but slightly offset by headwinds from Mainland China due to sporadic lockdowns there as a result of COVID-19 in FY22.
With this EBITDA recovery, Shangri-La Group net losses in FY22 narrowed significantly by 45.5% to USD 158.5m in FY22 (FY21: USD 290.6m). One large contributor was a foreign exchange (“FX”) loss of about USD 110.3m, though this was an exceptional item due to the significant depreciation of the Sri Lankan rupee affecting Sri Lankan bank loans. Another large contributor was depreciation (approx. USD 278.1m), though this is a fairly stable figure that is not expected to increase significantly even in the event of a revenue rebound (Chart 3). Therefore, while net losses would typically be a red flag for us, we believe that Shangri-La Group remains on the path to profitability as seen from EBITDA figures above.
Within the key hotel properties segment, we also witness a broad-based recovery. This is especially apparent in revenue per available room (“RevPAR”) figures which are calculated from the average occupancy rates and daily room rates (Table 1). Weighted RevPAR climbed a solid 25% yoy in FY22, with seven of its top eight geographies (by revenue) seeing double-digit growth in RevPAR as well. The sole exception was Mainland China due to the presence of pandemic measures, though we will discuss that in our outlook below.
Chart 1: Consolidated revenue saw a solid +17.8% from FY21 to FY22
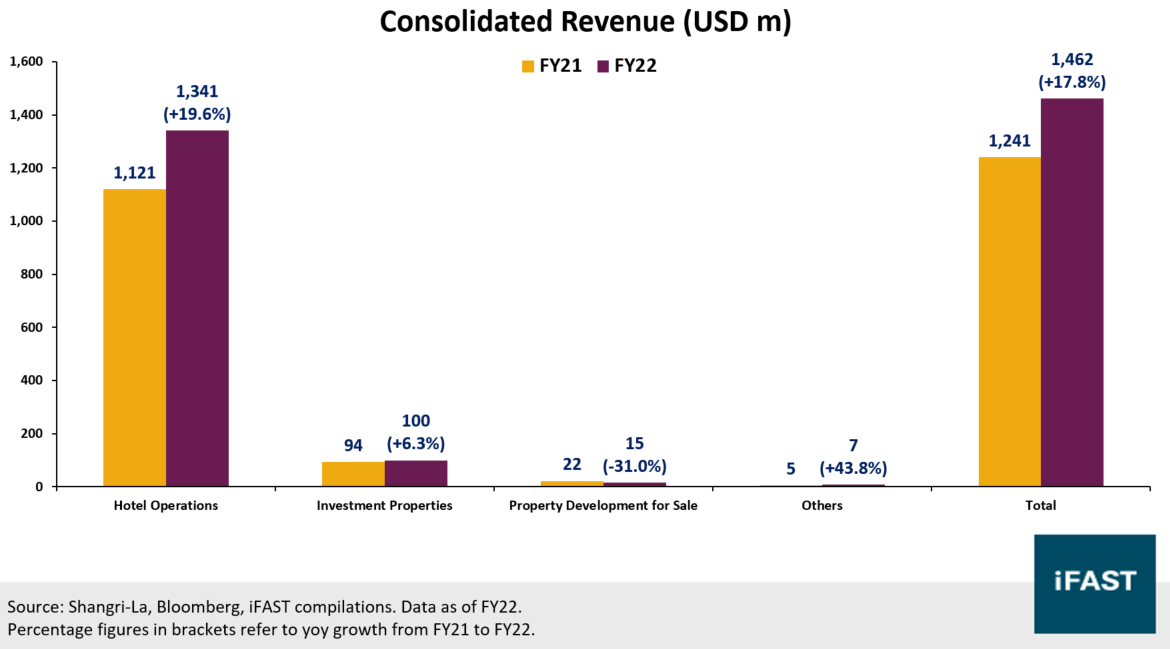
Chart 2: Profitability metrics also improved slightly from FY21 to FY22
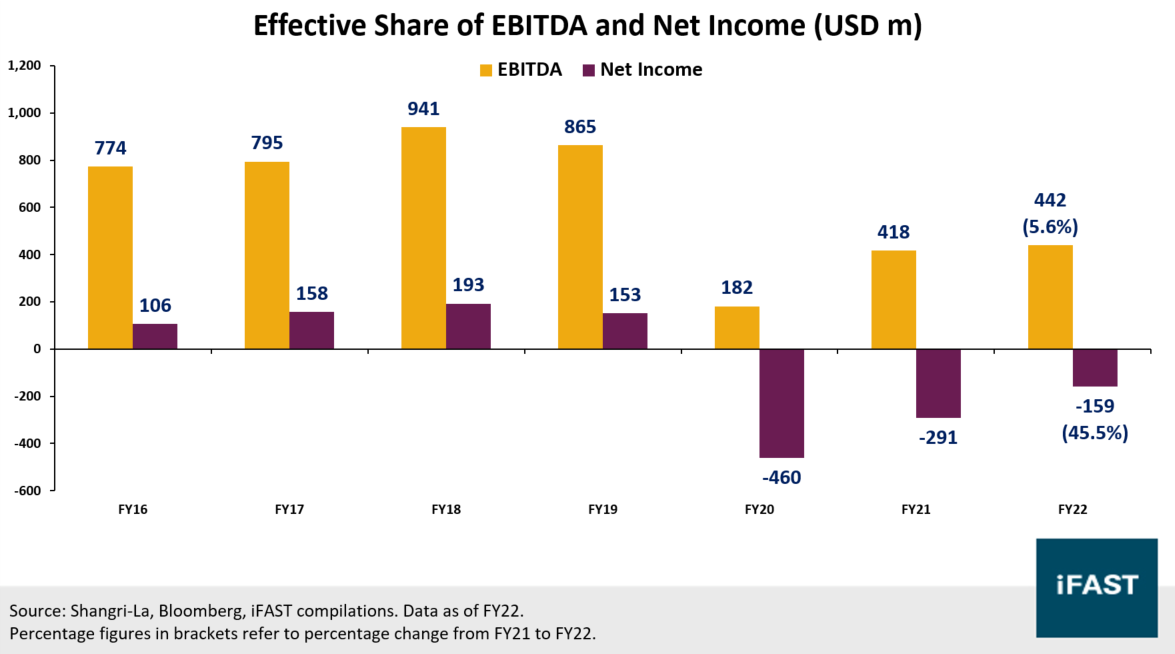
Chart 3: Amount attributable to depreciation and amortisation is fairly stable
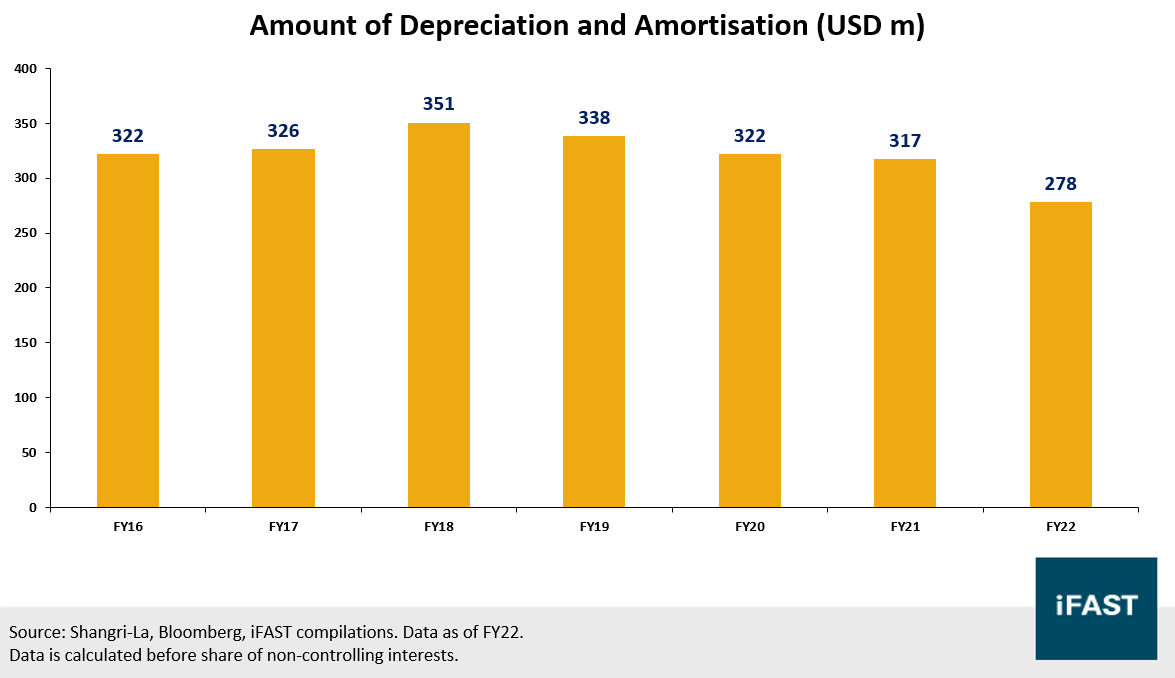
Table 1: Hotel RevPAR saw a broad-based increase across most key geographies except Mainland China
| Market Segment | FY21 RevPAR (USD) | FY22 RevPAR (USD) | Yoy Change (%) |
| Mainland China | 56 | 37 | -34% |
| Singapore | 54 | 150 | 178% |
| Hong Kong | 56 | 75 | 34% |
| Philippines | 22 | 89 | 305% |
| Malaysia | 16 | 52 | 225% |
| Australia | 81 | 176 | 117% |
| United Kingdom | 331 | 483 | 46% |
| France | 672 | 930 | 38% |
| Total Weighted Average | 51 | 64 | 25% |
| Source: Shangri-La, iFAST compilations. Data as of FY22. | |||
Outlook: Expect a boost from the China reopening
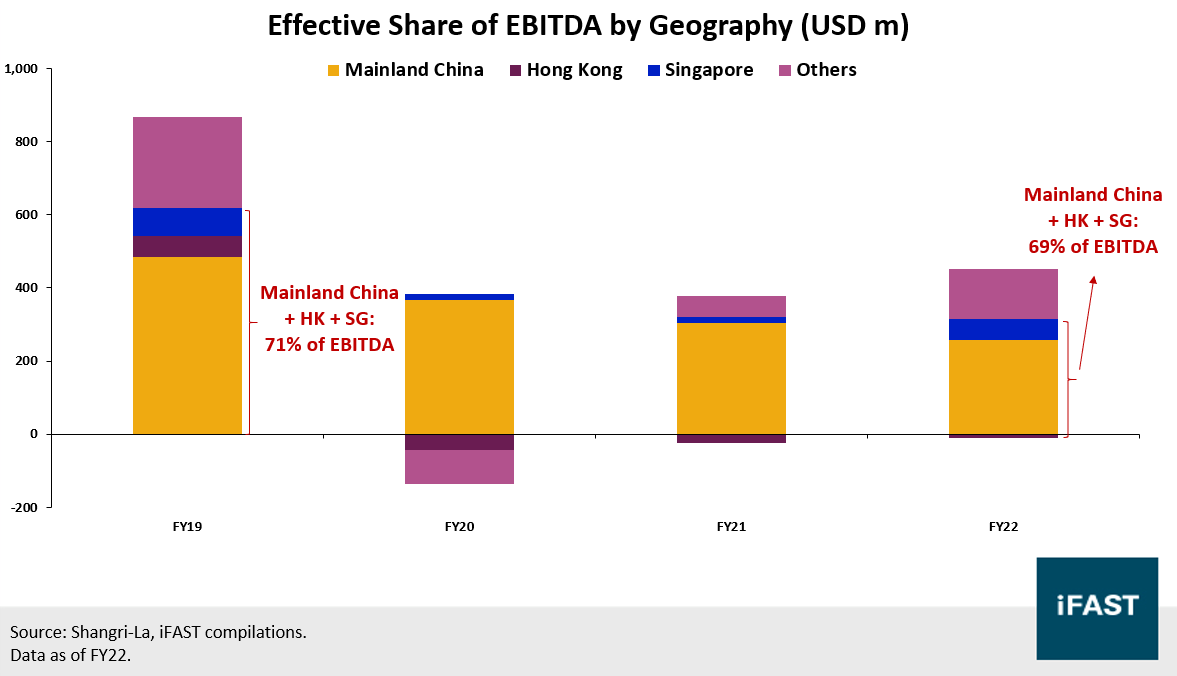
Looking ahead, Shangri-La Group continues to expect an accelerated China reopening to provide tailwinds for the company. This is especially important for the Mainland China, Hong Kong, and Singapore markets which constitute a large proportion of EBITDA (Chart 4), and markets which management has said are predominantly driven by Mainland Chinese consumers.
In fact, management has already witnessed a surge in Mainland China demand over the 2023 Chinese New Year period (not reflected in FY22 Financials). Given that Mainland China was one of the key detractors of performance in FY22, we think that this could potentially be a new catalyst for an improvement in Shangri-La’s financials. Given this, we are inclined to agree that there could potentially be a positive financial impact on Shangri-La Group as early as FY23.
Chart 4: Mainland China, Hong Kong, and Singapore account for a large proportion of EBITDA
Credit highlights
Shangri-La Group’s liquidity has remained relatively decent following the improved financial performance in FY22 (Table 2). The Group saw positive operating cash flows for the first time since 2019, while several key liquidity metrics (current ratio, cash ratio, operating cash flow) also improved slightly. We also note that the company retains approximately USD 737m of undrawn and committed bank facilities maturing after FY23, to support its near-term funding needs.
As for Shangri-La Group’s longer-term credit profile, we acknowledge that it appears to be somewhat weaker in FY22, but think it remains stable (Table 3). For instance, its net-debt-to-equity ratio worsened from 79.4% to 89.3%, which management attributed to the weakening of global currencies against the USD in FY22 – this is a trend we think could begin reversing this year. Investors should also note that the value of total equity is significantly lower than its fair value, which may affect the calculation of this ratio. Meanwhile, its net debt-to-EBITDA (effective share of EBITDA) improved slightly from 11.5X to 11.0X, while its interest coverage ratio remained stable at 2.0X.
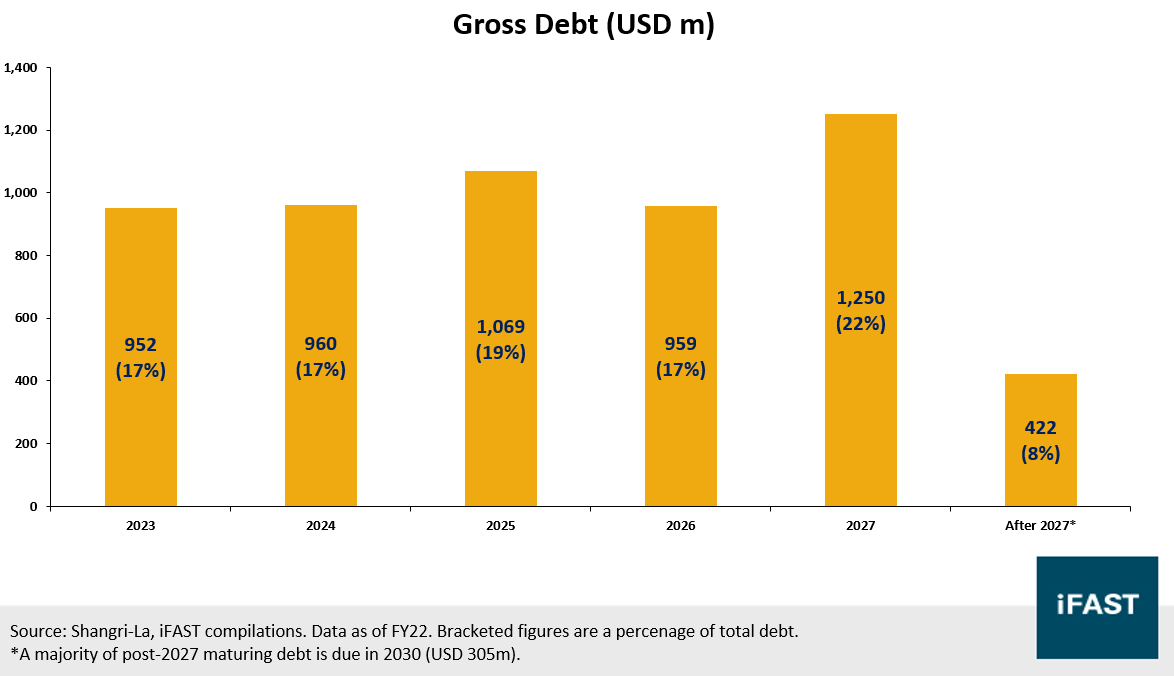
We also believe Shangri-La Group’s debt maturity schedule remains manageable (Chart 5). Its debt has a weighted term of 3.53 years, with just about one-third of its debt due by end-2024. Considering its (i) current cash position and undrawn bank facilities highlighted above; (ii) the potential for an improvement in Group performance this year also highlighted above; and (iii) the fact that management has already completed 67% of its total FY23 refinancing needs, we think it will be able to meet its near-term obligations. This should also be helped by the fact that a majority (60.6%) of its interest liabilities are on fixed rates (including those hedged with interest rate swaps), which could help to mitigate interest costs in this higher-for-longer rates environment.
Table 2: Liquidity profile remains relatively decent
| Shangri-La's Liquidity Metrics | FY21 | FY22 |
| Current Assets (USD m) (A) | 1,344 | 1,238 |
| Current Liabilities (USD m) (B) | 1,952 | 1,727 |
| Current Ratio (A / B) | 0.69 | 0.72 |
| Cash & CE (USD m) (C)* | 746 | 753 |
| Cash Ratio (C / B) | 0.38 | 0.44 |
| Operating Cash Flow (USD m) (D) | -51 | 33 |
| Operating Cash Flow Ratio (D / B) | -0.03 | 0.02 |
| Source:
Shangri-La, Bloomberg, iFAST compilations. Data as of FY22. *Figure excludes short-term deposits with original maturities over 3 months. |
||
Table 3: Longer-term credit profile is also relatively stable
| Shangri-La's Credit Metrics | FY21 | FY22 |
| Net Debt (USD m) (A) | 4,803 | 4,846 |
| Total Equity (USD m) (B)* | 6,050 | 5,425 (11,395) |
| Net Debt / Equity Ratio (A / B)* | 79.4% | 89.3% (43%) |
| Effective Share of EBITDA (C) | 418 | 442 |
| Net Debt / EBITDA Ratio (A / C) | 11.5 | 11.0 |
| Interest Expense (D) | 206 | 219 |
| Interest Coverage Ratio (C / D) | 2.0 | 2.0 |
Source:
Shangri-La, Bloomberg, iFAST compilations. Data as of FY22. *Bracketed values use non-GAAP adjusted equity values based on fair value
of hotel properties using internal/external valuations. GAAP accounting
states hotel properties at historical cost less depreciation/impairment. |
||
Chart 5: Debt maturity schedule is manageable with just one-third due by 2024
Recommendation
We compare SLHSP 4.500% 12Nov2025 Corp (SGD) to a Shangri-La Hotels bond maturing in 2030, and a Hotel Properties Limited (“HPL”) bond with a similar maturity (in 2025) (Table 5).
A comparison of Shangri-La Hotel’s two bonds
While the SLHSP 3.500% 29Jan2030 Corp (SGD) has a yield pickup of approximately 22.8 basis points (“bps”) over the SLHSP 4.500% 12Nov2025 Corp (SGD), we think this yield pickup is insufficient for the significantly longer maturity (by about 4.2 years):
- The 2030 bond has a significantly higher modified duration of 5.7 years (2025 bond: 2.2 years). Considering the persistence of inflation globally, we think that there could be significant duration risks with longer-dated bonds, which do not appear to be sufficiently compensated in this scenario with this meagre 22.8bps yield-pickup.
- Investors also face larger issuer risks with this longer-dated bond. The initial boost from China’s reopening will likely be a nearer-term tailwind and is unlikely to last until 2030. As such, investors in the 2030 bond will face more uncertainty over the Group’s ability to continue doing well after this post-reopening boost from China.
A comparison with HPL’s 2025 bond
We also compare it with the HPLSP 3.800% 02Jun2025 Corp (SGD). Looking at the same ratios used in our analysis above, it appears that their overall credit profile looks roughly comparable. However, we note that Shangri-La Group’s debt is fully unsecured, while HPL has over SGD 1b of secured debt (by mortgages on properties, assets etc.), potentially giving Shangri-La Group some room to refinance its debt by pledging its assets in a more dire scenario.
In addition, HPL already saw a sharper increase in revenue in FY22 (+33.0%), unlike Shangri-La Group (+17.8%) which was held back by a poor Mainland China performance – we attribute this to their differences in revenue composition (HPL is focused on Maldives and Singapore). Given this, while both players can be beneficiaries of reopening tailwinds in China, we think that Shangri-La’s financials could potentially see larger benefits in the near term given its Mainland China exposure.
Table 4: Credit metrics of Shangri-La Group and HPL are fairly comparable
| Credit Metrics (FY22) | Shangri-La Group | Hotel Properties Limited |
| Current Ratio | 0.72 | 0.92 |
| Cash Ratio | 0.44 | 0.23 |
| Operating Cash Flow Ratio | 0.02 | 0.38 |
| Net Debt / Equity Ratio | 89.3% | 81.0% |
| Net Debt / EBITDA Ratio* | 11.0 | 16.7 |
| Interest Coverage Ratio | 2.0 | 1.6 |
Source:
Shangri-La, HPL, Bloomberg, iFAST compilations. Data as of FY22 (31 Dec
2022). *Note that Shangri-La's figure uses effective share of EBITDA. |
||
Final recommendation: Shangri-La’s 4.500% bonds
To summarise, Shangri-La Group saw an improved performance in FY22 and is expected to continue improving its earnings on the back of reopening tailwinds, particularly with China only lifting its zero-COVID policy in late FY22. We also think it is likely able to meet its near-term obligations considering its broader credit profile.
Compared to its 2030 peer from the same issuer, we like its significantly shorter maturity for only a small yield discount. Compared to its 2025 peer from HPL, we think it offers investors slightly greater exposure to a China reopening for a relatively similar yield. Therefore, our recommendation is the SLHSP 4.500% 12Nov2025 Corp (SGD).
Table 5: Recommendation - SLHSP 4.500% 12Nov2025 Corp (SGD)
| Bond Name | Maturity Date (Years to Maturity) |
Ask Price | Current Yield | Yield to Maturity (%) |
| SLHSP 4.500% 12Nov2025 Corp (SGD) |
12 Nov 2025 (2.4) |
100.650 | 4.471% | 4.203% |
| SLHSP 3.500% 29Jan2030 Corp (SGD) |
29 Jan 2030 (6.6) |
94.748 | 3.694% | 4.431% |
| HPLSP 3.800% 02Jun2025 Corp (SGD) |
02 Jun 2025 (1.9) |
99.228 | 3.830% | 4.226% |
| Source: Bloomberg, Bondsupermart, iFAST compilations. Data as of 06 Jul 2023. | ||||
Declaration: For specific disclosure, at the time of publication of this report, IFPL (via its connected and associated entities) holds a NIL position in SLHSP 4.500% 12Nov2025 Corp (SGD), SLHSP 3.500% 29Jan2030 Corp (SGD), and HPLSP 3.800% 02Jun2025 Corp (SGD). The analyst who produced this report holds a NIL position in the abovementioned securities.
Our podcast series, Yield Hunters, is available on Spotify, iTunes Podcasts and Google Podcasts. We share our thoughts on new bond issues and hold discussions on the fixed income space. Listen to our latest episode below and follow us!